
Online Help Pitfalls
Plasmasphere Related |
Region: Polar Cap
|
| Problem Type |
Frequency of Occurence |
Ease of detection |
Remediable? |
Data Loss Severity |
|---|---|---|---|---|
| Electrostatic wake |
Frequent |
Moderate |
No |
Complete |
Examples of good EFW data in the polar cap
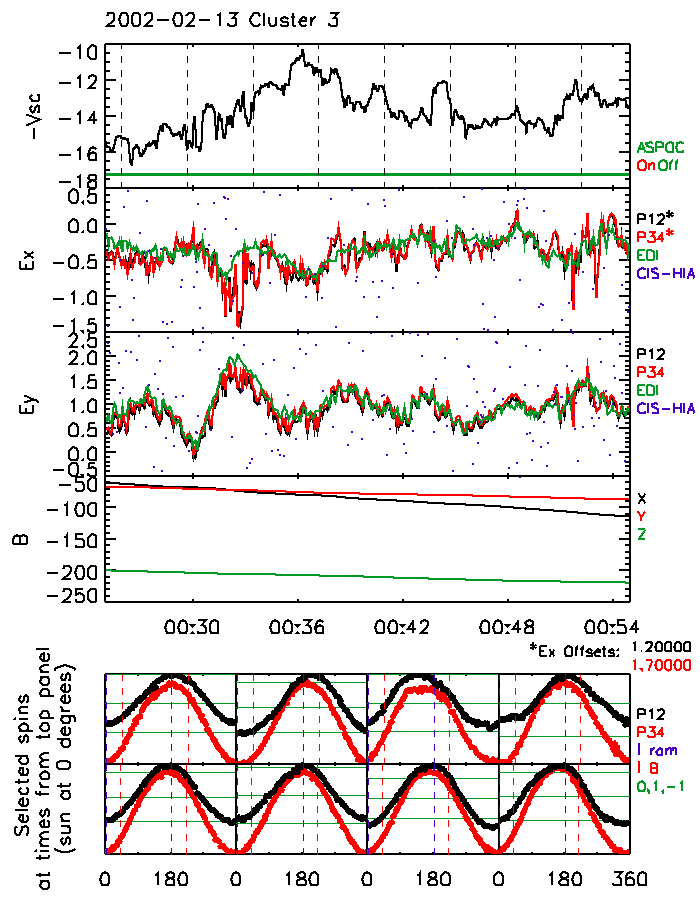 This
data, from 2002-02-13 (C3), shows good agreement between
both probe pairs of EFW (red, black) and EDI (green). Low densities
mean that CIS cannot get a good estimate of the flow velocity (scattered
blue dots). Agreement seems to be slightly better in the y direction,
which is not unusual. Offsets of 1.2 (P12) and 1.7 (P34) mV/m have
been subtracted in the X direction. Individual waveforms are
rather sinusiodal. More information on figure quantities is given here. This
data, from 2002-02-13 (C3), shows good agreement between
both probe pairs of EFW (red, black) and EDI (green). Low densities
mean that CIS cannot get a good estimate of the flow velocity (scattered
blue dots). Agreement seems to be slightly better in the y direction,
which is not unusual. Offsets of 1.2 (P12) and 1.7 (P34) mV/m have
been subtracted in the X direction. Individual waveforms are
rather sinusiodal. More information on figure quantities is given here. |
Problem: Electrostatic Wakes.
| Examples of the problem |
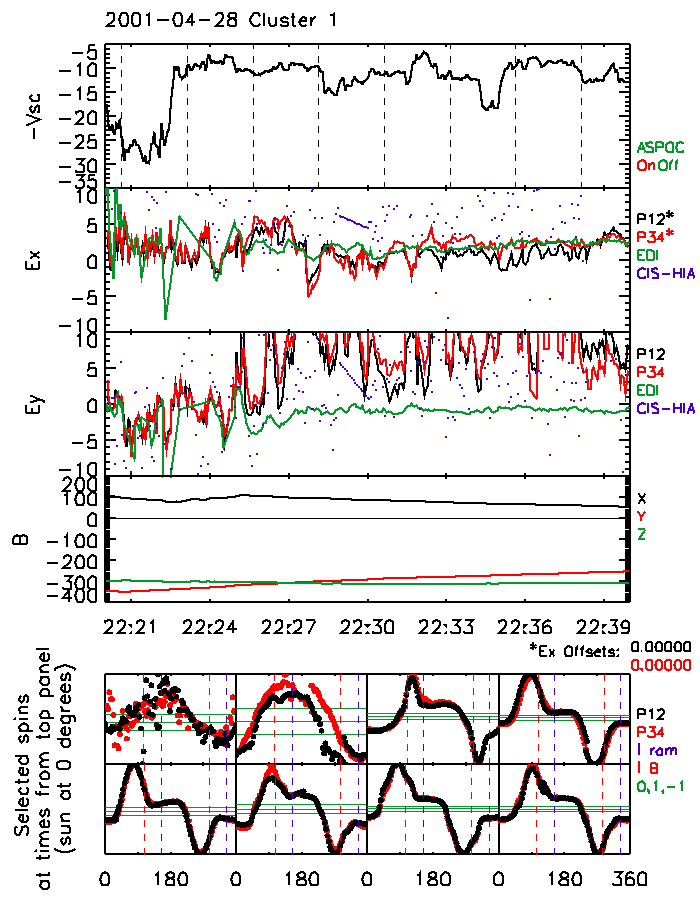
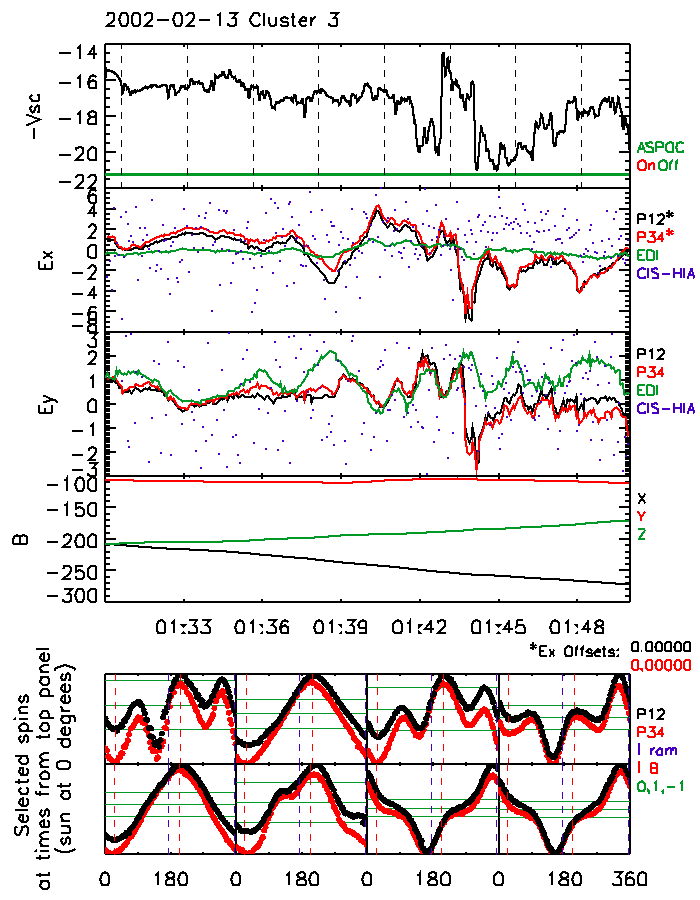
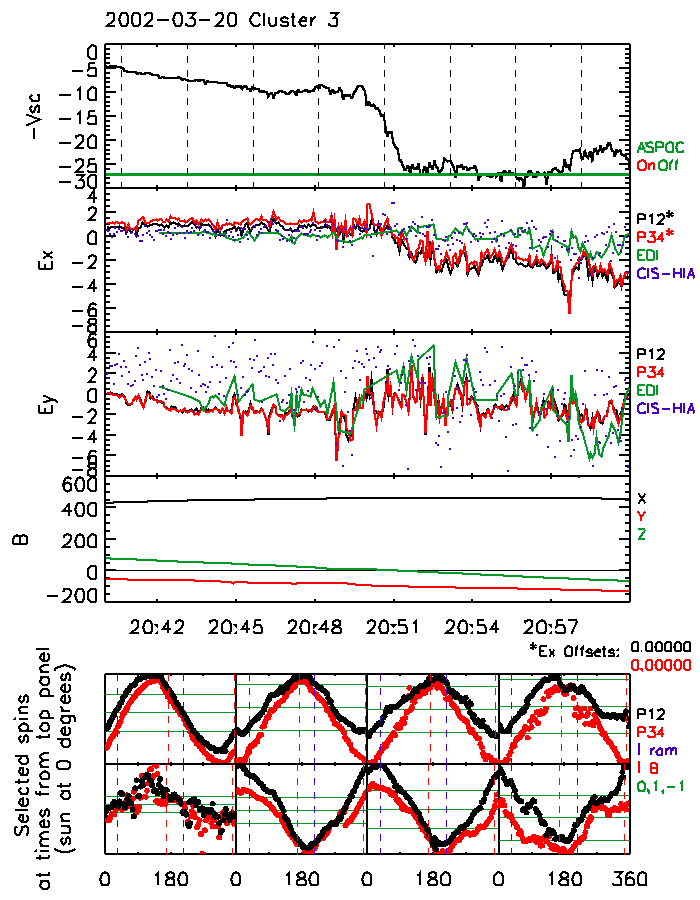
2002-04-28 2220 C1 Polar cap data from shortly after perigee, showing electrostatic wake structures. The structures align with the projected magnetic field direction. Description of the plotted quantities. 2002-02-13 0130 C3 This data, from the polar cap just before the satellite encountered the auroral zone, shows highly non-sinusoidal spins. The wake-like structures align neither with the projected magnetic field direction nor with the projected velocity vector. Description of the plotted quantities. 2002-03-20 2040 C3 Here is a less extreme example. Description of the plotted quantities. |
| Description of the problem |
The data shows non-linear wake-like structures, and is in disagreement with simultaneous CIS or EDI measurements. |
| How can it be detected? |
The
data, when plotted either as a function of spin angle or as a function of
time, show highly non-sinusoidal behaviour. The wake usually shows
up as a pair of spikes that usually (but not always) occur near the field
aligned direction. Highly non-sinusoidal data is always suspect.
Less extreme examples may be difficult to see. Comparison with
other instruments is always warranted. |
| How can it be corrected? |
Small
perturbations are sometimes remediable using a robust spinfit technique.
Large perturbations probably cannot be corrected. |
| Why does it occur? |
The
plasma in the polar cap is cold, supersonic and of low density. When
this plasma encounters the spacecraft, a wake is left in the flow direction
(nearly field-aligned). The effective size of the spacecraft is given
by the electrostatic potential surrounding it, and not by the physical size.
Since the wire booms are also at spacecraft potential, they therefore cast
a wake of their own. The wake is therefore large, and may encompass our probes.
When this happens, a spurious wake field is measured. Some predictions
of this model include:
|
| Other notes |
Back to pitfalls and problems.