This type of figure is frequently used in the "potential pitfalls" section
of the documentation. The images are all 700x900 resolution, although
they are usually displayed at a smaller size so as to fit better on the page.
To view them at full resolution, right-click on the image and select
"view image" (Netscape) or "show picture" (IE). The image format is
png (Portable Network Graphics). This seems to be a problem on older
windows-based browsers. Possible workarounds include the Quick Time
plugin, or upgrading to a later browser such as Netscape 7. I should
probably switch these over to gif format for back-compatibility.
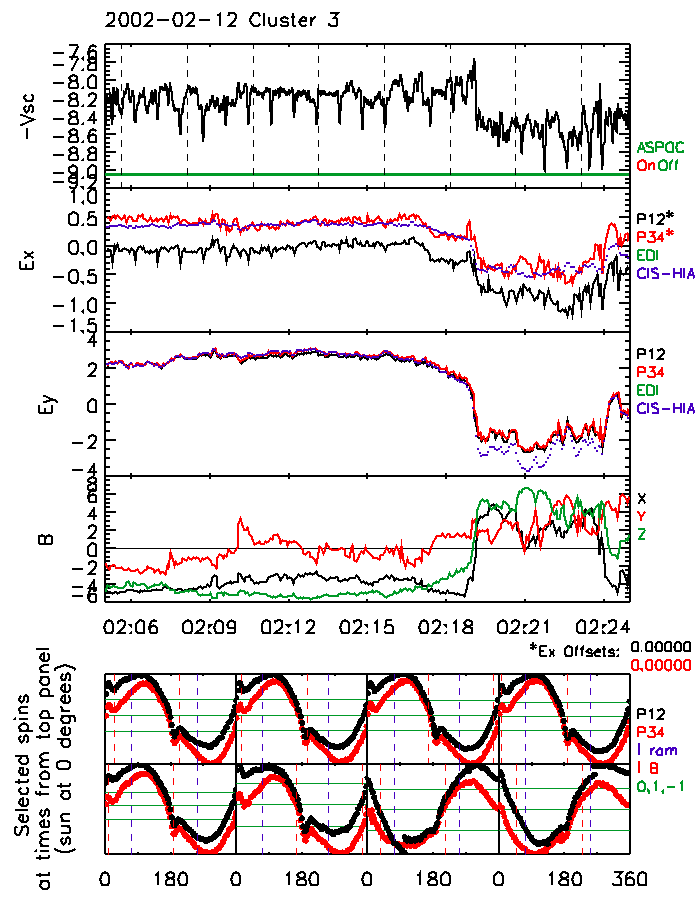
The top panel gives the negative satellite potential. The solid line
at the bottom gives the ASPOC status. Green means off, while red means
on. Dashed vertical lines indicate the times of the spins shown in
the bottom panels. Time (marked at the bottom of panel 4) is in decimal hours.
The second panel gives Ex. The black line is from probe pair
1-2, while the red line comes from pair 3-4. The green line is EDI
data, while the blue points are estimates of E from CIS-HIA and FGM prime
parameter data. Some plots may have orange points, which are from CIS-CODIF.
Moments from CODIF are not generally as reliable as those from HIA.
The reference frame is stationary; that is, the satellite VxB field
has been subtracted.
The third panel gives Ey. The colour coding is the same as in panel 2.
The fourth panel is the magnetic field (spin resolution from FGM).
Black is the GSE X component, red is Y amd green is Z. Time is
in decimal hours.
The bottom panels give sample spins, from the times indicated by dashed lines
in the top panel. Black is for probe pair 12, while red is for 34.
The signal is plotted as a function of sun angle; the sun is located
at 0 degrees. The interval selected is not necessarily centred from
0 to 360 degrees, so time does not necessarily monotonically increase from
left to right. Red dashed lines mark the angle that the projected magnetic
field makes in the spin plane (parallel and antiparallel), while blue lines
mark the projected ram direction. Green lines mark 0 and +/- 1 nT.